我的需求
在 Antd Pro 后台 table 列表,每行数据对应 InfluxDB 一个 measurement tag 一个时间点所有 field 数据。
例如:
一行数据为,一个网站指定网页在某一分钟的 UV,PV。下一行数据为下一分钟的相应数据。
InfluxDB 2.0 默认的返回 table 是怎样的
先写入测试数据,假设 org 为 sunzhongwei.com,bucket 也是 sunzhongwei.com。
里面的:
- measurement 分为两个 sunzhongwei.com 和 google.com。
- tag:page 有两个值 home 和 tool,代表两个页面
- field key: 有两个,一个是 uv (访问用户数),一个是 pv (访问页面数)。
influx write \
-b sunzhongwei.com \
-o sunzhongwei.com \
'sunzhongwei.com,page=home uv=2,pv=10'
influx write \
-b sunzhongwei.com \
-o sunzhongwei.com \
'sunzhongwei.com,page=tool uv=20,pv=110'
influx write \
-b sunzhongwei.com \
-o sunzhongwei.com \
'google.com,page=home uv=200,pv=10000'
直接查询的话
from(bucket: "sunzhongwei.com")
  |> range(start: v.timeRangeStart, stop: v.timeRangeStop)
会发现查询结果被分割成了6个 table, 如图 (InfluxDB UI 后台):
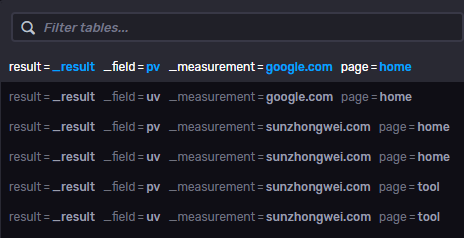
可以看出,查询结果会根据不同的 measurement 和 tag, field 组合,每一个组合对应一个新的 table。
每个 table 中是:
- time
- value
- field
- measurement
- tag
pivot 使 table 包含多个 field
from(bucket: "sunzhongwei.com")
  |> range(start: v.timeRangeStart, stop: v.timeRangeStop)
  |> pivot(
    rowKey:["_time"],
    columnKey: ["_field"],
    valueColumn: "_value"
  )
此时会看到查询结果由6个 table 变成了 3 个:
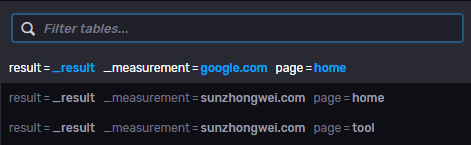
pv, uv 变成了 table 中的 field name。

正是我想要的效果。
pivot
pivot 中文翻译为:旋转运动 … 😭
The pivot() function collects values stored vertically (column-wise) in a table and aligns them horizontally (row-wise) into logical sets.
总结
InfluxDB 2.0 的资料还是非常少,英文的都很难查到,更不要说中文的。
还是需要把官方文档粗略地翻一遍。
参考
- https://docs.influxdata.com/influxdb/cloud/query-data/common-queries/multiple-fields-in-calculations/
关于作者 🌱
我是来自山东烟台的一名开发者,有感兴趣的话题,或者软件开发需求,欢迎加微信 zhongwei 聊聊,或者关注我的个人公众号“大象工具”, 查看更多联系方式